Image Analysis Software

Nikon NIS-Elements Imaging Software

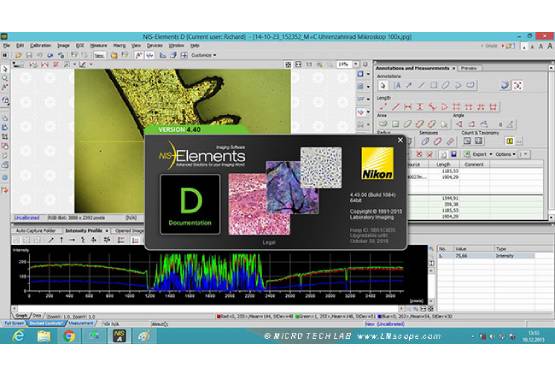
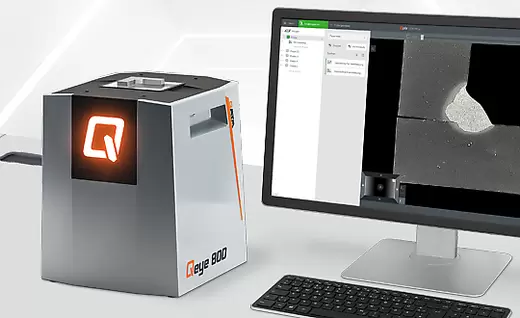
NIS-Elements is a fully featured imaging software solution for microscopy. Fast, powerful imaging processing tools are available, such as for creating a mosaic or compound image from many separate images, e.g. following a long micro-crack on a sample surface from start to finish. For industrial or academia applications, Nikon offers NIS-Elements AR (Advanced Research), BR (Basic Research), D (Documentation), and L (for a tablet PC).

  • NIS-Elements AR:The NIS-Elements AR image analysis software version is optimized for advanced research applications, offering fully automated acquisition and device control through full 6D image capture (X, Y, Z, Lambda (wavelength), time, multiple points) and a wide range of image analysis capabilities
  • NIS-Elements BR: Developed for standard research applications such as analysis and photo-documentation of microscopy images, NIS-Elements BR features up to four-dimensional acquisition and advanced device control capabilities
  • NIS-Elements D: NIS-Elements D is a software package for photo-documentation, including basic measuring and reporting tools
  • NIS-Elements L: Easily view images and control their acquisition settings for the Digital Sight 1000, DS-Fi3 and DS-Ri2 cameras on a tablet PC using NIS-Elements L

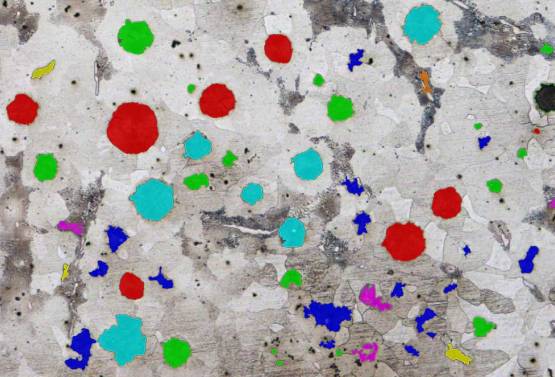
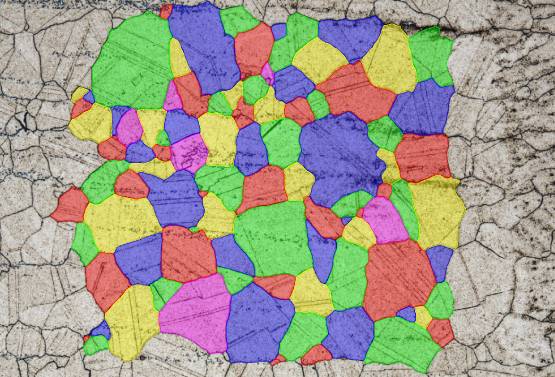
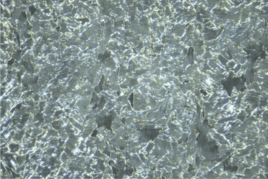
Artificial Intelligence (AI) software for grain size detection in Aluminum/Bronze/Austenitic and Ferritic single-phase structures.

AI and machine learning make automatic grain segmentation and distinction an effortless process for the user. Traditional manual thresholding for grain segmentation can be challenging and tedious, even for experienced operators. With AI, this method can often become obsolete.

Key features

  • One-click detection
  • Automatic and complete grain segmentation and distinction without complexity
  • Flexibility depending on the sample type
  • The AI network can recognize grains across a wide range of images due to extensive training on numerous samples
  • AI simplifies grain distinction, requiring no effort from the user
  • Reliable AI grain detection works primarily with Aluminum/Bronze/Austenitic and Ferritic single-phase structures, and similar material samples viewed in polarized light with or without the use of a lambda plate
  • Additional image samples can continually be added to the AI network
  • The AI software comes pre-trained for your applications

Measurement Sequencer Software for Weld Seam Measurement

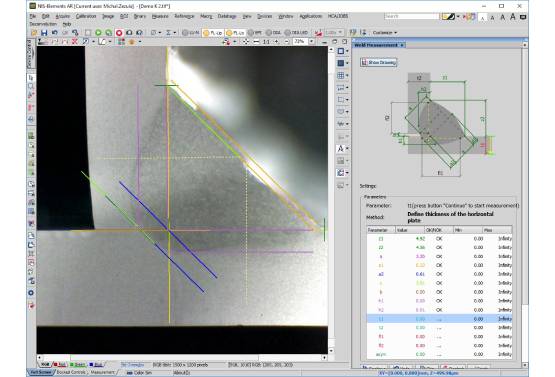
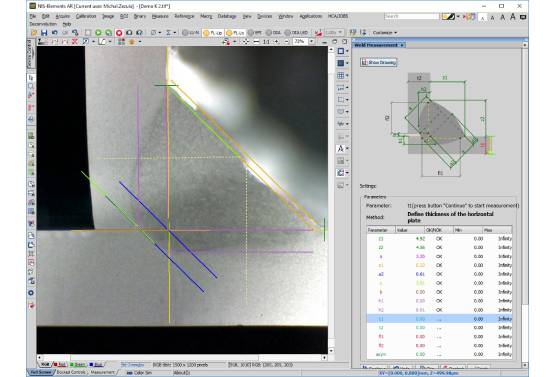
This is an additional software plugin module for weld measurement applications, featuring an automated sequence definition for measurements (e.g., predefined ISO 5187 Fillet & Butt welds and custom-defined recipes). It offers guided measurement functionality, ideal for reducing user errors. This practically eliminates the possibility of missed steps during measurement procedures and ensures that no measurements are omitted from your reports.

With a built-in guidance system for designing measurements, users can follow schematic instructions and tips for convenient, easy, and accurate measurements. Simply point and click to place your measurements. Additionally, the software provides a text-to-speech guide for further assistance.

The predefined measurement sequence definitions include:

  • ISO 5187 Butt Weld
  • ISO 5187 Fillet Weld
  • Brinell Hardness
  • Knoop Hardness
  • Vickers Hardness
  • Plate Pole Weld
  • Spot Weld
  • Lap Weld
  • Fillet Weld
  • Custom-defined measurement definitions

These options offer a wide range of automated measurements, ensuring that various types of welds and hardness tests can be performed accurately and efficiently.

Report Generation (Reports)

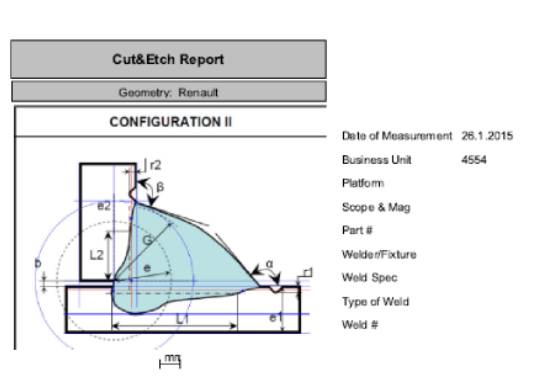
  • Complete report including an image with geometric measurements displayed on it
  • Measurement table with limits and validations
  • Overall result indicator
  • Export reports in PDF, RTF, or MS Excel formats
  • Export images in TIF, JP2, BMP, or JPG formats
  • Create custom reports tailored to your measurement definitions

These features ensure that detailed and customizable reports can be produced for documentation and analysis purposes.

Parameter and Progress Monitoring Over Time

Image Organizer

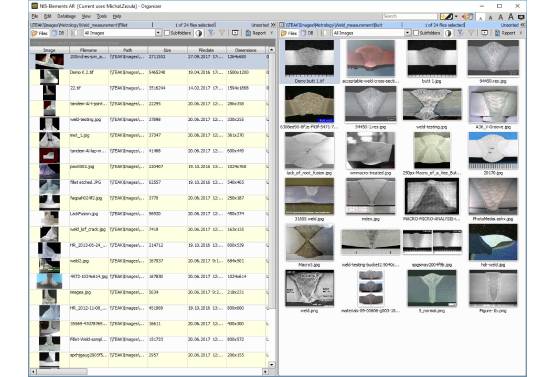
  • Browse through all measured images and their corresponding results by clicking on any of the defined measurement parameters
  • Compare measured parameters and track their progress over time using graphs
  • Efficiently organize and access images for quick retrieval and analysis
  • Visualize measurement trends and evaluate changes in key parameters at a glance
  • This feature streamlines the process of managing and analyzing images, enabling users to quickly compare and monitor the progression of critical measurements over time with graphical insights.

Building and Customizing Your Own Measurement Definitions

  • Create once, execute repeatedly
  • Build measurements without programming knowledge
  • Comprehensive geometric options for various measurements
  • Ability to add guidance tips for easy execution
  • Option to define custom calculations, validations, and limits (even using JavaScript)
  • Load a custom image for your guidance scheme
  • Data includes the measured image with export capabilities

This feature allows users to tailor their measurement processes to specific needs, providing flexibility in defining custom metrics, calculations, and limits while ensuring ease of use and repeatability.

Image

10, Agion Anargiron Str.
Marousi Attica, 151 24
Greece

+30 2107243529
[email protected]

QUESTIONS? SEND A MESSAGE